
First a recap:
We started with the five key questions of analysis ;
What is the Problem?
Where are we?
How did we get here?
Where would we go from here in future?
How do we change the future?
We have covered first two questions about problem statement and situations analysis.
Now is the time to tackle the third one.
HOW DID WE GET HERE?
You have noted right. HERE is our point A. By now we should have known what our point A looks like. Situation analysis will cover the dimensions of Point-A and the place around the point A looks. The latter we called Contextual Analysis.
Let’s get back to some examples of problems and issues.
44 % of school age children are out of school in our country. This is despite the extra resources directed to the provinces who have the responsibility of education portfolio exclusively. The situation is worse in the case of girl children and certain regions where the out of school children is highest. These are the areas that have also received maximum funding, but the school enrolment remains low.
Company’s sales are dropping and 30 % of customer have been lost. This is despite the fact that company is spending highest on advertising. The new products have also failed to make a difference. Even sharing the margins with retailers is not working.
Climate change is getting worse every year. The weather pattern is changing, rains are low, and productivity is falling. There is risk that Indus basin which is the breadbasket of the country will turn to drought.
AVOID THE SOLUTION YET, PLEASE
The situation analysis can be as elaborate and broad as one wants it to be, but after some time it will become problem repetition. We wanted to know about the problem, and we have gotten to know more than enough. Now the question is how to get out of the mess. One convenient and lazy approach would be what I call Import a Solution.
All of us have heard about the uncles who are walking physicians. They hear you sneezing and will immediately scream, aah this is new strain of flu, take the medicine I have taken, and you will be alright. Or you are having trouble finding a job and they know someone who landed a job through volunteering, so you need to volunteer as well. Policy sphere is also abundant in such quacks who have a ready made solution up their sleeves.
Of course, Import a solution hardly works but walking physicians are never out of fashion. In fact, jumping directly from problem to solution is popular but approach. I call this approach lure of solution. Ours is the time of quick decision makers who have answers before even the question surfaces. Leaders, CEOs and executives look bad if they don’t have a string of solutions handy. We are also encouraged to be futuristic, and of course we know that past is another country.
True and accurate analysis is linking and visualizing the reality in past, present and future. Problem and situation analysis define our present. Solutions are designed to avoid repeating the present in future. But where does present come from?
Causation analysis is determining the factors which shaped the present and removal of these factors will change the future. When talking about the causation, the famous adage needs to be made a header or footer so that it is never out of sight.
You have guessed it right.
CORRELATION IS NOT CAUSATION
Correlation-Causation debate has led to countless memes. My favorite is this one.

I would start with a basic concept from physics i.e function- a relationship between the dependent and independent variables. We have to identify the dependent variable i.e out of school children, falling sales and climate change and then make two sets of fictitious or dummy equations, ideal and problem. These are dummy because there is no quantitative backing. The point here is to identify the variables at least.
First the key equation. What will be the function for children enrolment, company sales, and climate change.
children enrolment = f(schools, teachers, parents’ commitment, community, distance…)
Sales = f(product, marketing, distribution, quality assurnace…..)
Climate change =f (emissions, population….)
The above are the normal functions while the problem equation would have independent variables going in the opposite directions.
Low children enrolment = f(less schools, discouraging teachers, hostile community, unwilling parents)
Low Sales = f(bad product, weak marketing, dysfunctional distribution, ineffective quality assurance)
Bad climate = f (high emissions)
CONTRIBUTORY/CONTEXTUAL FACTORS TABLE
In case you find the function and equation appears daunting to you (it does appear to me), you can make a table of your own to identify the factors. But one should be clear to make a distinction between the contributory and contextual factors.
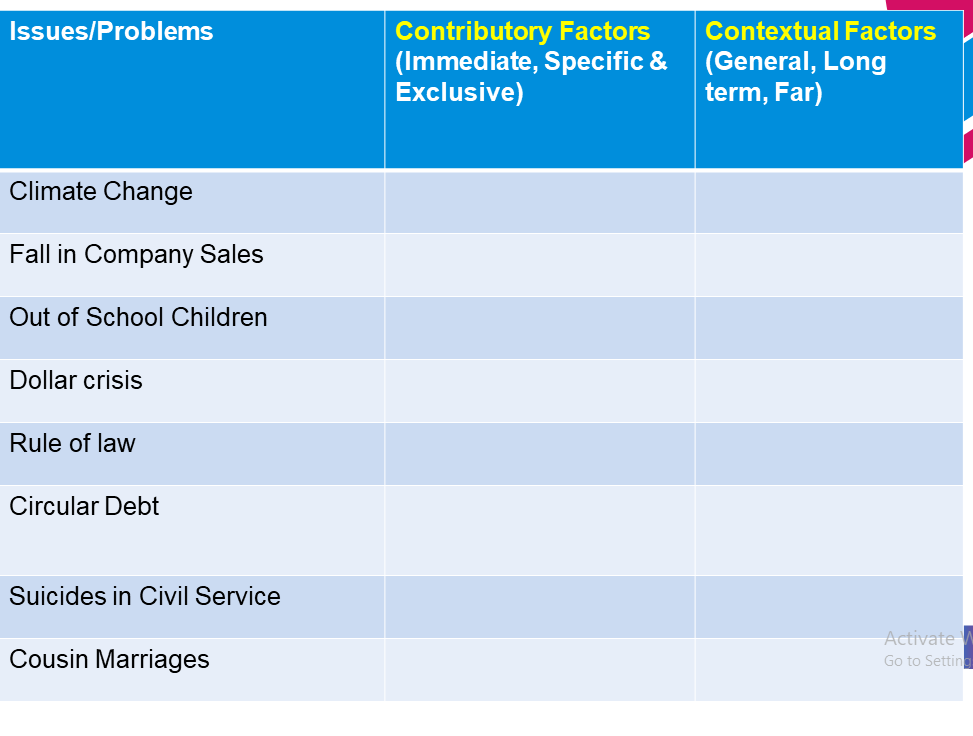
The distinction between the contributory and contextual factors is crucial in mapping the pathway to present problem. Too many cliches and stereotypes are always circulating when it comes to policy and business problems. The purpose of analysis is to identify the contributory factors while considering the contextual factors which have shaped these contributory factors.
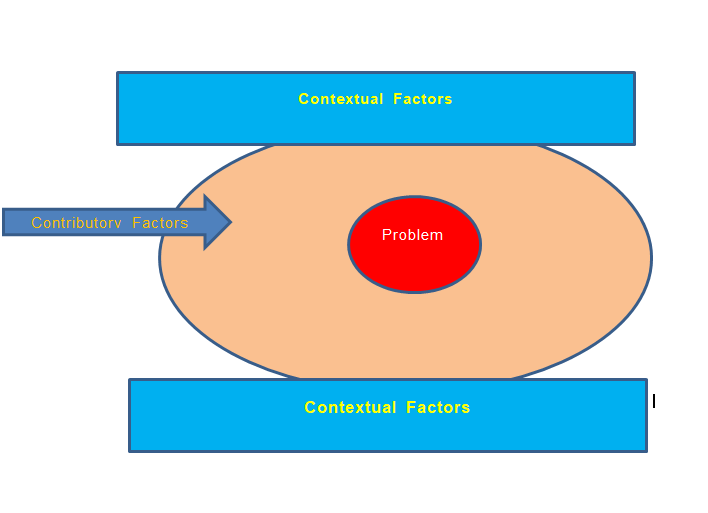
As the above picture shows, the problem exists in the contributory factors sphere which are shaped by the contextual factors. Poverty is contextual factor which affect whether parents send their children to school or not, but many poor parents do send their children to school. What is the defining difference between the poor parents who send their children to school and others who don’t?
Contributory factors directly, immediately and exclusively affect the outcome which results in the persistence of problem. Contextual factors are too broad, too general and almost too independent to be dealt with directly. To focus disproportionally on the contextual factors leads to analysis being open ended and almost resignation in front of problems. After all, the poverty, conservatism and narrow mindedness will remain forever. To blame them is akin to shirk one’s responsibility and move on with life.
BECAUSE STATEMNT
Causation analysis should conclude with the BECAUSE statement.
Social media is anti-social BECAUSE……contributory factors first and contextual factors later
44 % of school going children are out of school BECAUSE …..contributory factors first and contextual factors later
Company sales are dropping BECAUSE…..
Climate change situation is getting worse BECAUSE…….
Parliamentary system is better than presidential BECASUE……
Economic crisis is crisis of public sector BECAUSE……
The history will repeat itself in Afghanistan BECAUSE…..
Leaders are made not born BECAUSE…...
Crisis is only failed public relations BECAUSE……
If you are not using BECAUSE, you are not exploring causation
Data Visualization- Trends and Patterns
Trends and Patterns are favorite tools of analysts. Even a pedestrian or basic analysis will appear good with some graphs thrown in and trend lines shown rising or falling.
Trends emerge across time- Trend is relationship of one variable with time being the other variable. By showing trend, you only get to see what the problem looked back in time- was it less, more or constant. Trend thus show correlation, but we have to find causation.
Patterns are formed with in a space. Patterns take time as constant and identify the space while mapping the problem. Patterns are territorial or geographical representation of the problem space.
Trends and patterns are useful & convenient but can also be tricky and deceptive specially when it comes to causation and forecasting. In-fact , trends and patterns hardly identify the relationship of one variable with other variable. Thus trends and patterns suffer from correlation-causation fallacy
Let’s look at some of these trends and patterns
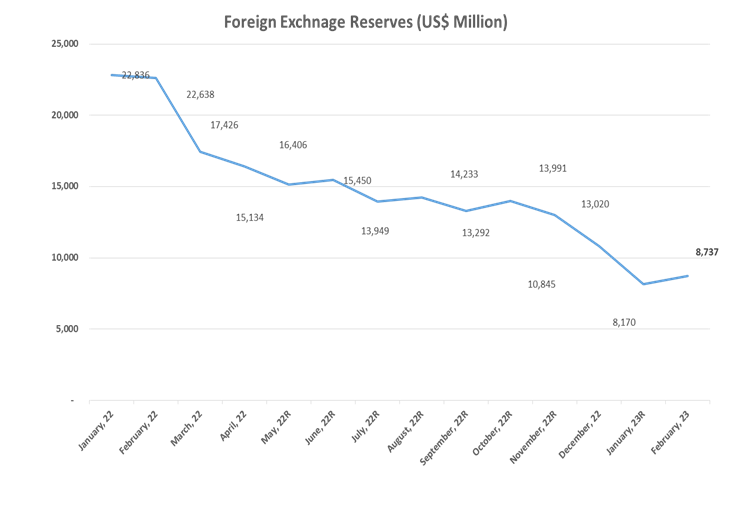
This graph is classic Trend graph. It can be presented as analysis but to call it analysis would be no less than insult to the term analysis. It just shows the high level of reserves in Jan 22 and their rapid fall over thirteen-month period. Analytical question is finding the factors (contributory & contextual) which caused that fall.
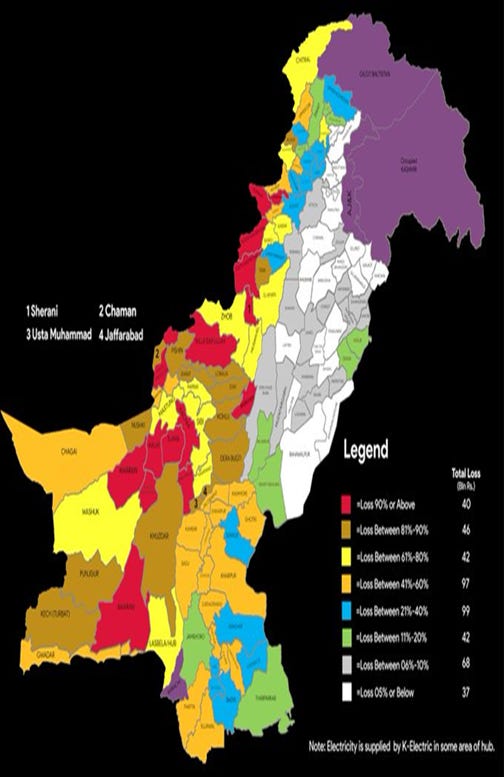
The above shape is the classic pattern analysis electricity theft across districts in Pakistan. Red is above 90 % theft, brown between 80 & 90 & and white less than 5 %. It says as much it does - the rogue districts lie in Balochistan and KP Provinces. But why is the question that reader has to answer himself.
Taking the case of out of school children, here is one pattern of where the out of school children is found
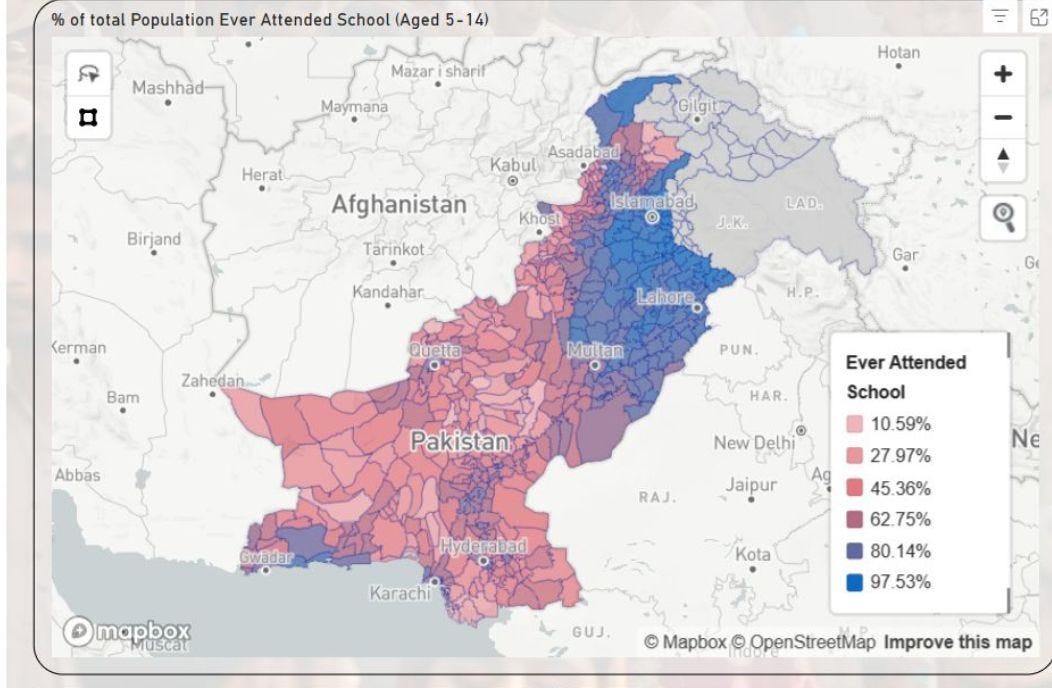
Again, the map can be presented as the analysis, but it is merely mapping of problem. Analysis as we keep on harping, is finding how did we get here. For that we have to go deep and identify the specific patterns and then find the reasons behind the problem.
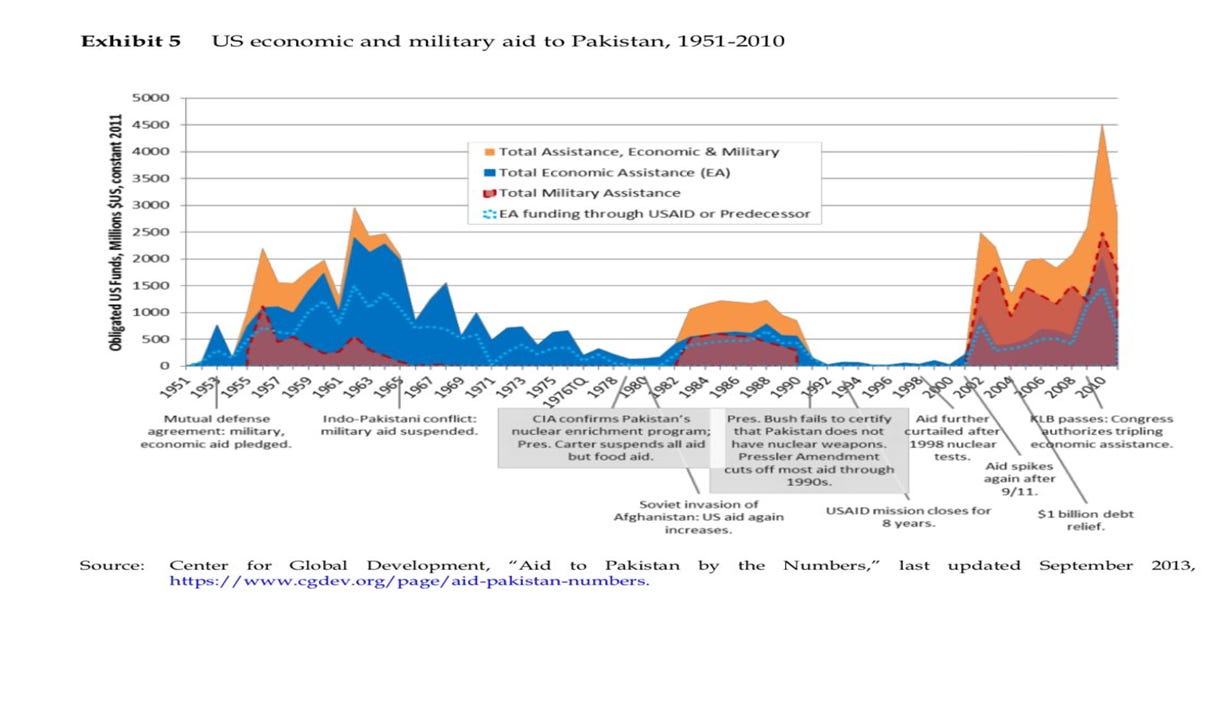
This one is better graph in so much that it includes both trend and patterns. The graph shows US assistance to Pakistan divided between economic, military and development aid. You get to see the periods of highs and lows of aid and also the composition or pattern. It is a neat situation analysis, but causation is still absent. Not that it cannot be deciphered. Like the informed observers of national security and international observers can identify the contributory factors like US intervention in Afghanistan and Cold War/War on Terror as contextual factors. But that is separate from this graph.
HISTORY TRAP
How did we get here, requires going into the past to find why we have the problem in present but final word of caution is in order. Past can also mean infinity just as future. How far in the past one needs to go. There is always a trap laid out which I call history trap- going way and way back.
Let’s take the chronic policy problems like poverty, unemployment, extremism, illiteracy etc. One can trace these as far as back to 1947 or even farther to the roots of colonialism. We are poor/illiterate/radical/unemployed because we were colonized, is the favorite trop in developing countries. I call it trope not because there is no historical basis to the adverse effects of colonialism. In fact there are more than sufficient evidence. My issue is with the reasoning which assumes a linear and straight causation ignoring all that is happening now, all the new developments and all the changes people have undergone recently and the world which is changing every passing day.
Apart from policy problems, the history trap is always lurking in personal, business and social problems. Just like the couples trace their issues to the very first day of marriage and the managers remember the day of interview when they were hired. In-fact, both would have seen high and low days since the first day. The history trap is something serious analysts should avoid, and solution lies in finding the inflection point.
Inflection point is the point when the tide started turning and did not recover. Like in the graphs shown above, one can see the inflection point when the foreign exchange reserves started falling and did not quite recover. The identification of inflection point depends upon analysts own insights but also on the data which is available to the analysts. A correct inflection point can give useful indications about the contributory and contextual factors.
Logically, the change in dependent variables is triggered by change in independent variables or factors. In case of sudden turn of events like fall in sales or foreign reserves, the factors that were sustaining the constant trend would have been replaced by the disruptive factors. In other cases, like out of school children, probably the fall would be more constant and slower. Still in that case, we have our inflection point given i.e the 18th amendment which was supposed provide positive contributory factors, but it does not appear to be the case.
Our inflection point will thus be to the left of our point-A. and the picture from the section WHAT IS THE PROBLEM, will look something like this
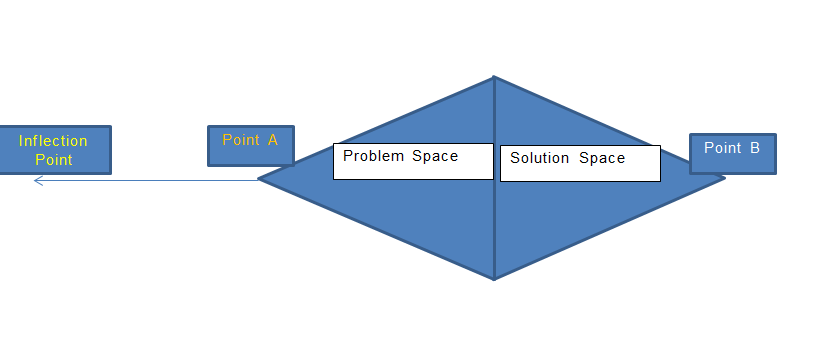
This part covers the area between the inflection point and problem point i.e point A. One of the common mistakes in analysis is start right with the inflection point or start in the past. That would be mistake because we can find or locate the inflection point with reference to the point-A. Otherwise, our inflection point will be arbitrary as is seen in many analyses which randomly pick a date in past and start telling the story.
The story part brings us to the writing part. The mapping of difference between the inflection points and point-A and identification of contributory and contextual factors will necessitate a story of what, how and why. Here the risk is that story will start looking like conclusion. In-fact the conclusion will come after the part-4 & 5 - Where should we go from here, and how to get there - solution. At this stage we only have what can be called as findings on the persistence of the problem. That is why the alternate name for this whole part can also be.
WHY THE PROBLEM PERSISTS?
I would recommend this question as sub-part because I consider process to be more important than the answers. In-fact better process will lead us to better answers. Otherwise, the temptation to jump to quick and shortcut answers is almost irresistible.
Taking the example of out of school children, if the question WHY THE PROBLEM PERSISTS is asked, there will be many short cut - conventional wisdom- readymade answers like poverty, radicalization, lack of infra-structures. These readymade reasons will lead to readymade solutions and the readymade solutions will have the same results as before.
But the answer is required to question WHY THE PROBLEM PERSIST and after mapping the journey, identification of factors and role of each variable into the persistence of problem, the analysis will reach a point where a definite and specific answer can be retrieved on the persistence of problem. This answer will be presented as the finding and will constitute a major milestone in analysis.
FINDING REASONS THROUGH REASONING
AI has a short and crisp definition of reasoning, “the process of using logic and evidence to think through situation and draw a conclusion. Exactly the sort of exercise we are indulging in. Identification and mapping of contextual vs contributory factors, drawing of trends and patterns and finding of outliers will provide us with the necessary evidence.
But how to apply logic.
One can fill pages and pages in explaining logic and it will remain elusive, that is the challenge of logic. So better to make it simple and close to the discussion about the problems and solutions, and our key question why the problem persists. Logic will help us getting to good cogent answers. How?
All of us start with some intelligence guesses and somethings accepted as truths. The intelligent guesses are called as assumptions and accepted truths are premises. We have to alos remember that we are in the realm of deductive reasoning i.e going from general to specific. Most of the analyses are based on deductive reasoning because the inductive exercise in reasoning is time-consuming, resource intensive and highly complex. Logic is needed along with evidence because there can never be enough evidence and answers come from choosing the best option through a rigorous and consistent process.
We can start with guesses which or assumptions and then employ evidence to test these assumptions. We are also aware of shortcuts called as premises. You might recall the famous example about premise- All humans are mortals, Socrates is human, therefore Socrates is mortal. The expression THEREFORE donates the operation of premise making. The fatal error in logic and consequently in analysis is to have incorrect, wrong or irrelevant premises and untested assumptions accepted as evidence.
Some examples of assumptions and premises in policy
Employees are motivated by monetary incentives (premise) therefore increasing salary will lead to better performance
People vote on the basis of quantitative indicators (premise) therefore if government is able to lower inflation rate, they will win the next elections.
Children drop out of school because their parents want them (premise) therefore giving money to the parents will improve school enrolment
Big governments are bad for the economy (premise) therefore slashing the bureaucracy will result in better governance
We can go on and on but the point perhaps clear by now is to answer the main question, how did we get here and sub-question why the problem persists. Answering these questions will lead us to the prediction about the future and devise measures to change the future.
More on that in coming pieces.
Thanks